Grafana Alerts on Spring Boot App
Credits : Pankaj Sharma
https://pankajtechblogs.dev/spring-boot-application-monitoring-using-prometheus-grafana-c9c0e6c001da
Application monitoring is a process that lets us know that an application is performing as expected. The technique used is to regularly identify, measure, and evaluate the performance of an application and alerts for any abnormalities or shortcomings in an application/service.
While monitoring serves as eyes and ears for an application, monitoring doesn’t fix any problem by itself, however just produces necessary reporting based on the server metrics, and reacts based on configured alerts, such as sending notifications over email to the organization’s support group.
While we have lots of Application monitoring tools available, here we will discuss one of the open-source tools for monitoring Kubernetes or docker deployed workloads.
Prometheus
- Prometheus is an open-source system monitoring and alerting toolkit originally built at SoundCloud.
- It is now a standalone open-source project and is maintained independently of any company.
Prometheus’s main features are —
- Works on the JVM metrics, which is basically the time-series data, identified by metric name and key/value pairs.
- To query the metrics for its targets, it uses PromQL — a flexible query language.
- It pulls for the metrics of the targets over HTTP.
- We can add targets manually using static configuration or can utilize the service discovery model.
- Multiple modes of producing reports as Graph’s or Table’s view.
Can be easily integrated with Grafana — Add a Datasource as Prometheus.
Prometheus’s components —
Prometheus ecosystem consists of multiple components. Let’s discuss few important ones and many of them are actually optional.
- Prometheus server which scrapes and stores time-series data.
- Alert manager which handles alerts in the system.
- Add instrumentation to code via one of the Prometheus client libraries — a client library that matches the language in which your application is written, which lets us define and expose internal metrics via an HTTP endpoint on your application’s instance.
Spring Boot + Prometheus
Let’s try to add Prometheus to our spring boot application, which will be using spring boot actuators to supply the metrics to the Prometheus server over HTTP. This Spring boot application will be, one of the Targets to scrape within specific regular intervals.
Here I am also, exploring the Netflix DGS framework, so I am going to expose this spring boot application as a GraphQL layer. We can integrate this on any spring boot application though.
Let’s start by adding dependencies to the project, here I am using the maven build tool.
<!-- Micrometer Prometheus registry  -->
<dependency>
    <groupId>io.micrometer</groupId>
    <artifactId>micrometer-registry-prometheus</artifactId>
</dependency><!-- Micrometer core dependecy  -->
<dependency>
    <groupId>io.micrometer</groupId>
    <artifactId>micrometer-core</artifactId>
</dependency><!-- Will utilize metrics using actuator--><dependency>
    <groupId>org.springframework.boot</groupId>
    <artifactId>spring-boot-starter-actuator</artifactId>
</dependency>
Here we will try to monitor the Timed series data using @Timed annotation, over the controller or specific methods.
So now, let’s add the following TimedConfiguration class, to initialize the bean, and define the custom common tags, we can define other configs as well, that will appear common for all the scrapes.
import io.micrometer.core.aop.TimedAspect;
import io.micrometer.core.instrument.MeterRegistry;
import org.springframework.context.annotation.Bean;
import org.springframework.context.annotation.Configuration;

@Configuration
public class TimedConfiguration {
    @Bean
    public TimedAspect timedAspect(MeterRegistry registry) {
        registry.config().commonTags("application","SampleNetflixDgsGraphQLApplication");
        return new TimedAspect(registry);
    }
}
And finally, let’s add the following properties to the application.properties
server.port=8082
server.servlet.context-path=/digital/v1/sample-netflixdgs#Enable the actuator to supply the metrics by exposing endpoints.
#For now we are not adding any security.management.security.enabled=false
management.endpoint.metrics.enabled=true
management.endpoints.web.exposure.include=*#Enable management endpoints for prometheus
#Set metrics export to true.management.endpoint.prometheus.enabled=true
management.metrics.export.prometheus.enabled=true
We are done configuring the application. Let’s boot up the application now.
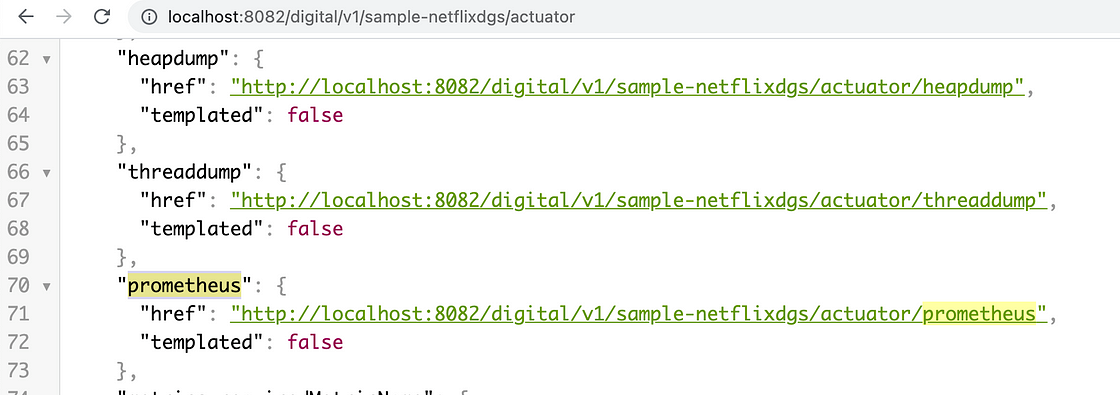
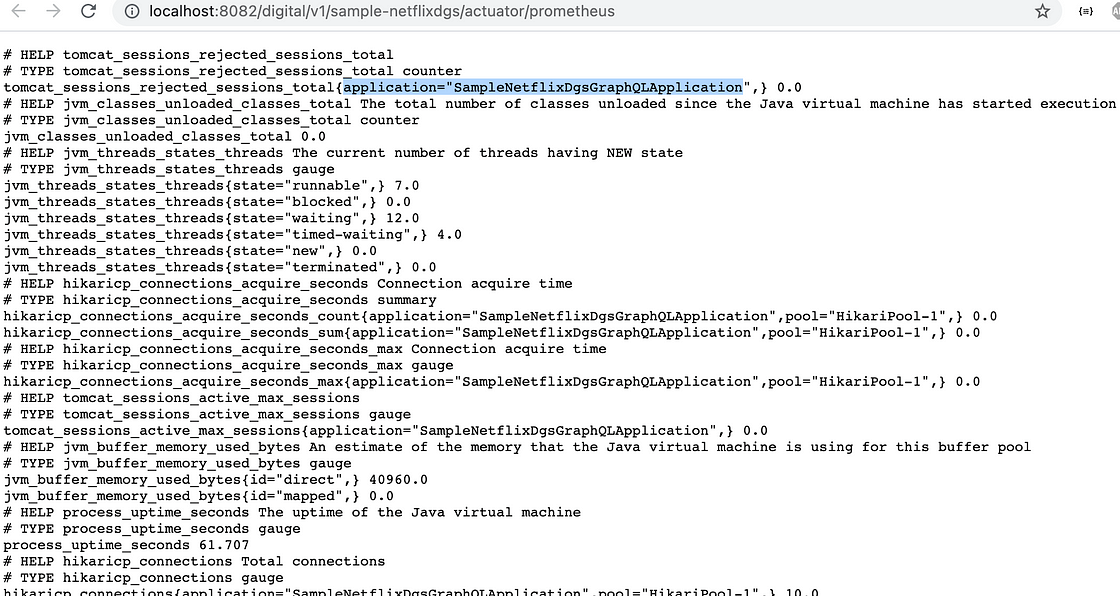
And hit the actuator endpoint, and we will notice the Prometheus endpoints are registered as well and enabled to send the metrics.
Part 1 is completed.
Now we need to bring up the Prometheus server which will scrape this application as a target.
For that either we can download the Prometheus distribution (from the Prometheus official website https://prometheus.io/download/) and get the server up and running, or can get the docker instance up and running in your installed Docker on your machine.
Run the below command to get the latest Prometheus image from the Docker hub.
docker pull prom/prometheus
Create the prometheus.yml file anywhere in your local folders and reference the path for the mount. Below is the reference from the official documentation, and I just enhanced it a bit.
global:
  scrape_interval:     15s # Set the scrape interval to every 15 seconds. Default is every 1 minute.
  evaluation_interval: 15s # Evaluate rules every 15 seconds. The default is every 1 minute.
  # scrape_timeout is set to the global default (10s).

# Load rules once and periodically evaluate them according to the global 'evaluation_interval'.
rule_files:
  # - "first_rules.yml"
  # - "second_rules.yml"

# A scrape configuration containing exactly one endpoint to scrape:
# Here it's Prometheus itself.
scrape_configs:
  # The job name is added as a label `job=<job_name>` to any timeseries scraped from this config.
  - job_name: 'prometheus'
    # metrics_path defaults to '/metrics'
    # scheme defaults to 'http'.
    scrape_interval: 5s
    static_configs:
    - targets: ['127.0.0.1:9090']

  - job_name: 'sample-netflix-dgs-graphql-service'
    metrics_path: '/digital/v1/sample-netflixdgs/actuator/prometheus'
    scrape_interval: 5s
    static_configs:
    - targets: ['192.168.29.245:8082']
Something to note — Under scrape_configs array, we have two job_name as of now, one is for the Prometheus server, on which we can get the metrics, and another one is for the created spring boot application. I am defining the metrics_path — which will be the actuator URL, on which the Prometheus is enabled as we saw in the previous picture and JVM metrics will be pulled by the Prometheus server using this context-path, at regular intervals of 5s, as mentioned under scrape_interval. Under targets, we are actually defining the IP of the machine, as this instance will be running over docker so 127.0.0.1 will not accessible, as the spring boot app is not yet deployed to docker and is running locally. 🙂 This won’t cause any issues.
Now, let’s run the container from the docker image we just pulled and supply this created YAML file.
docker run -d --name=prometheus -p 9090:9090 -v /Users/pankajsharma/Documents/reactive-workspace/sample-netflix-dgs-graphql-service/prometheus.yml:/etc/prometheus/prometheus.yml prom/prometheus --config.file=/etc/prometheus/prometheus.yml
And guess what we are done setting up the Prometheus and we can hit the endpoint — http://localhost:9090/
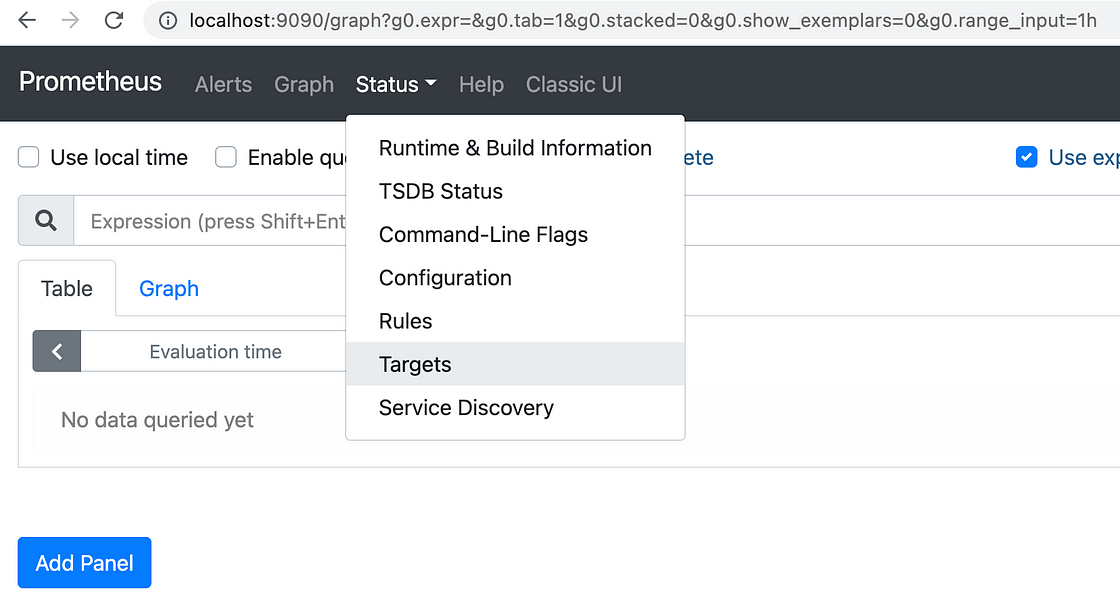
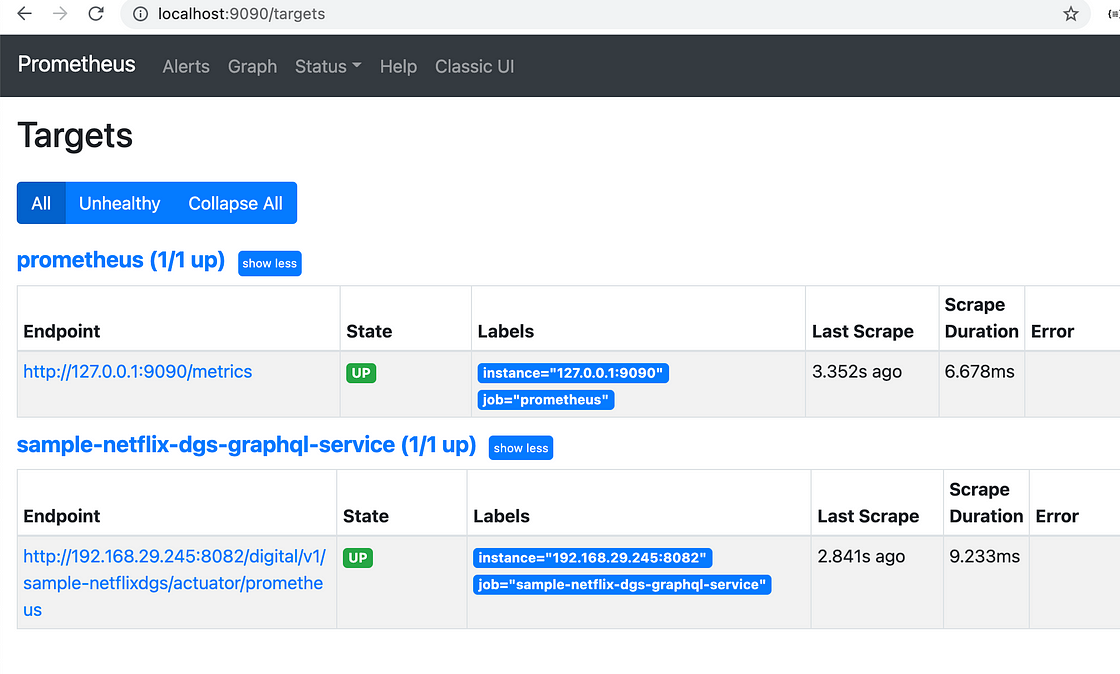
Now on the Prometheus application screen, we can check for the registered targets as per the mounted YAML configuration.
And we see that the spring boot application shows up and running, as depicted below.
Now we have N number of metrics available for us.
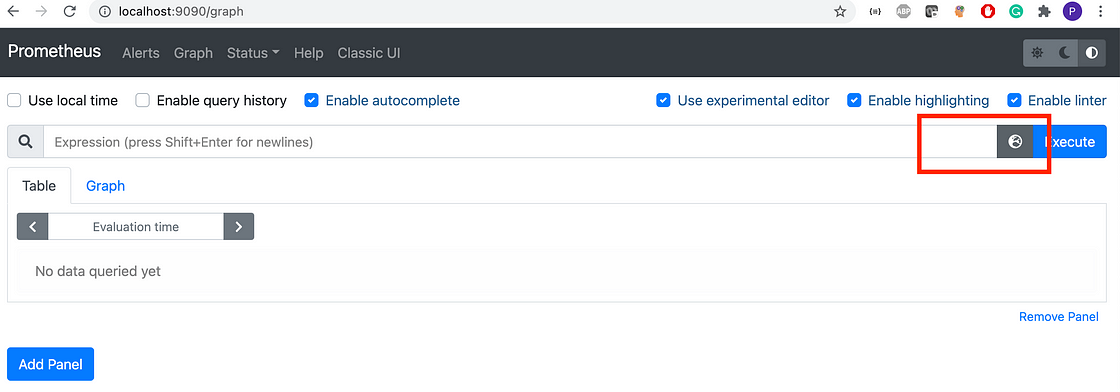
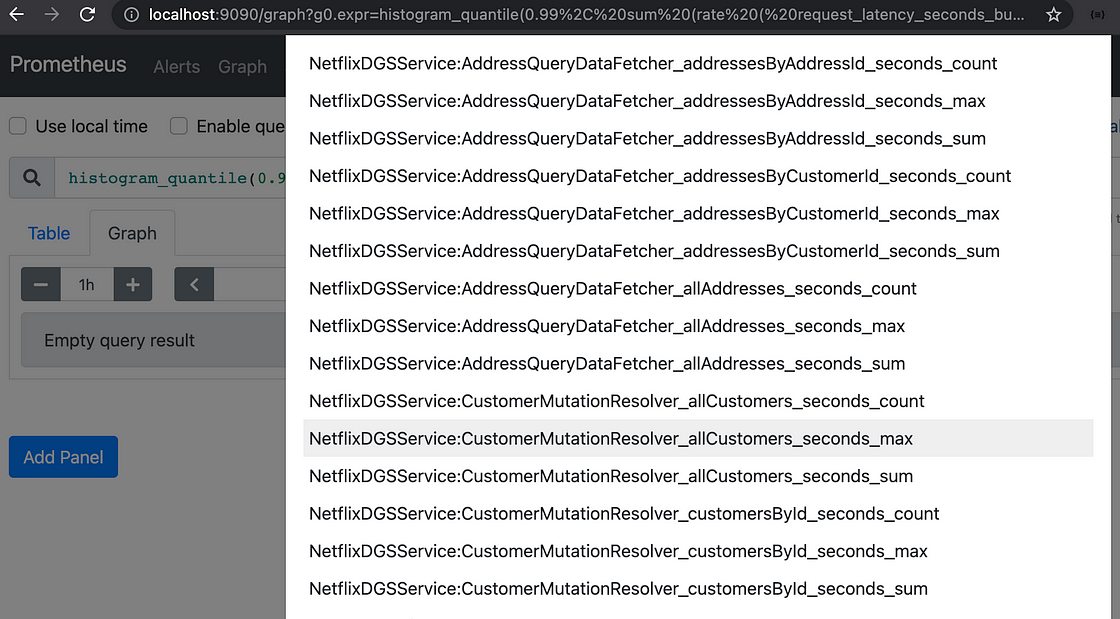
And we can explore them by navigating back to the Graph tab, and click on the Metrics explorer icon and select specific metrics individually.
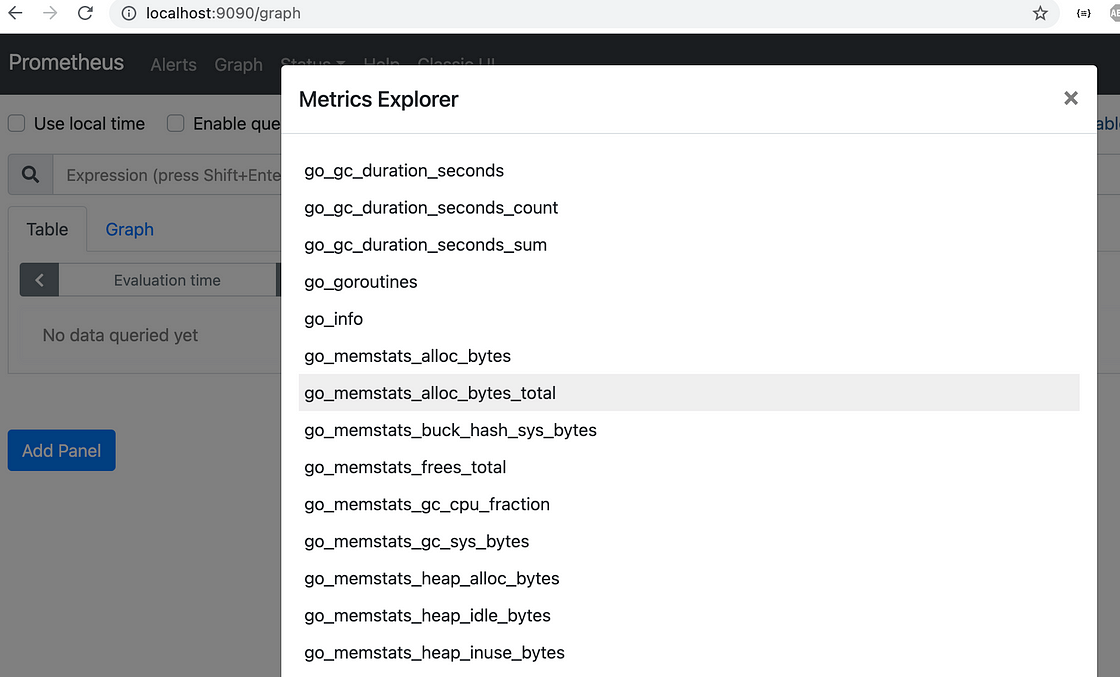
Let’s try to get the system_cpu_usage metrics of our spring boot application. To do so from the metrics explorer scroll to the bottom and you will see system_cpu_usage, click on that and click Execute button.
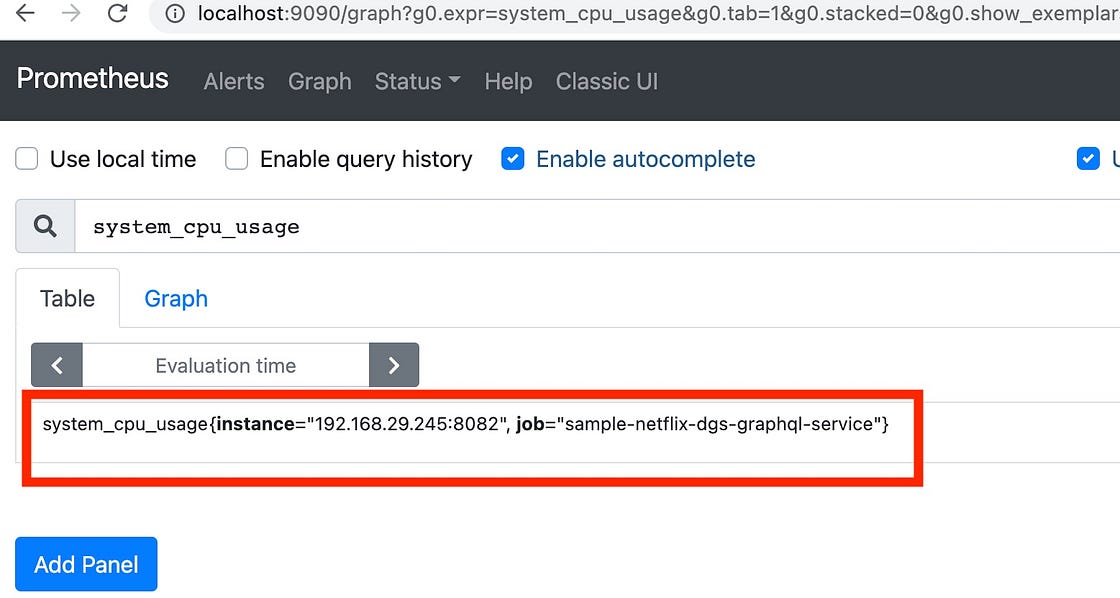
We will get the below screen in the table view.
Alternatively, we can get this see in Graph view as well. Just click on the Graph tab (mentioned just over evaluation time).
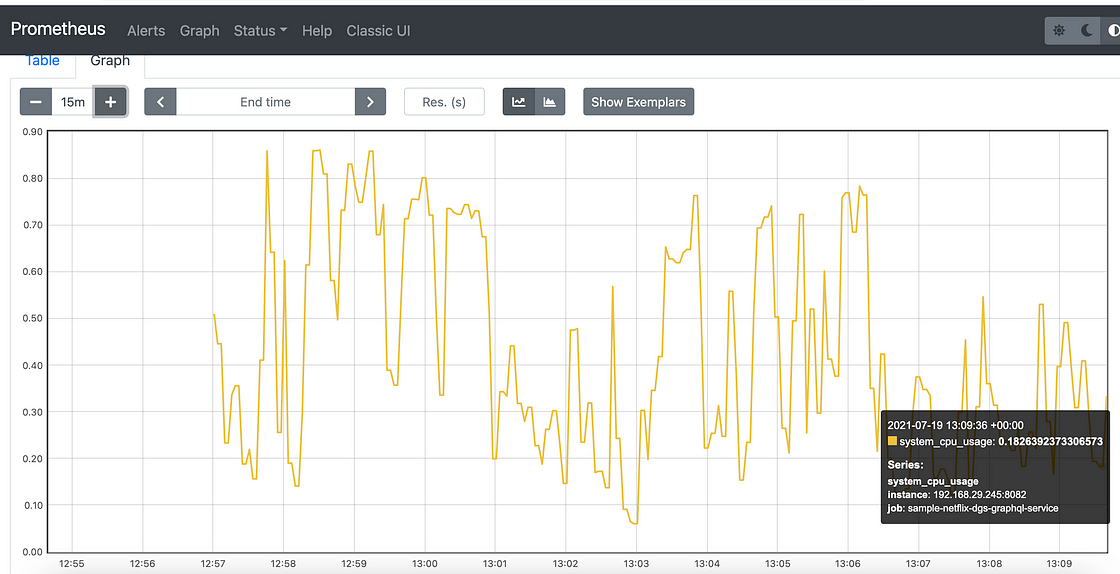
Let us generate some traffic for the spring boot application, by just hitting some endpoints of the application. And after hitting some endpoints I can see the details for API metrics as well since we did use @Timed annotation on the specific methods. Thanks to the micrometer registry integration.
Alerts
We can add alerts in the Prometheus YAML file and all those will appear under the Alerts tab. I will publish that in another blog, as it’s another topic in itself, and will try to add different rules under it.
Forming queries — using PromQL
We can explore further the Prometheus queries as well, we can read more about PromQL in official documentation — https://prometheus.io/docs/prometheus/latest/querying/basics/
Let’s see one example, to calculate 99th percentile request latency for the targets.
histogram_quantile(0.99,
          sum(rate(request_latency_seconds_bucket[5m]))
)
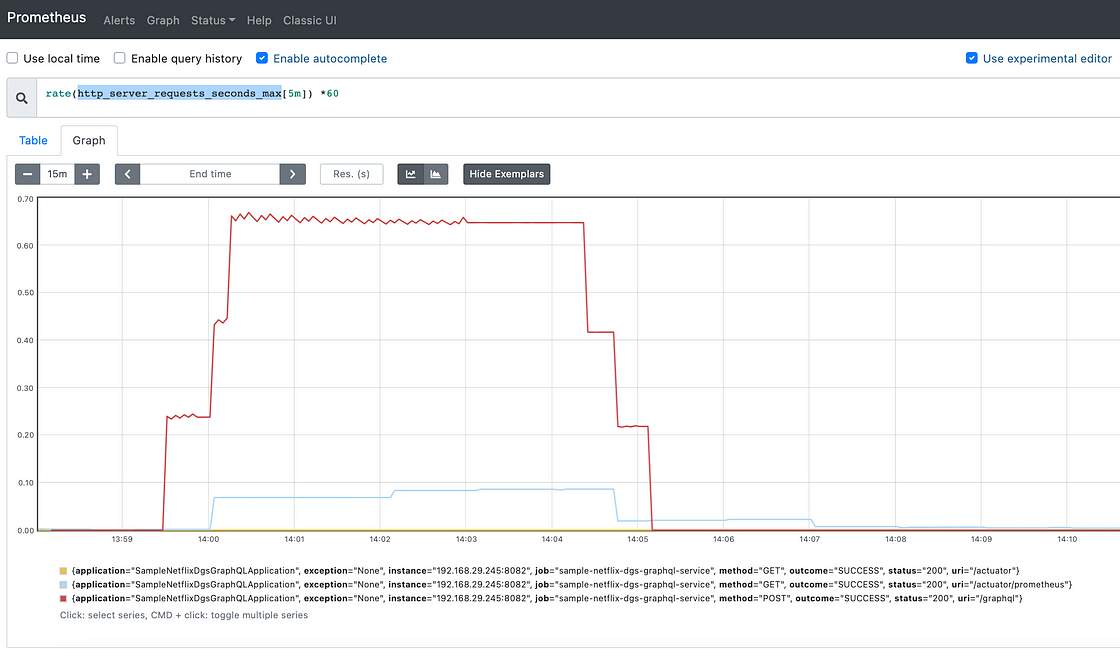
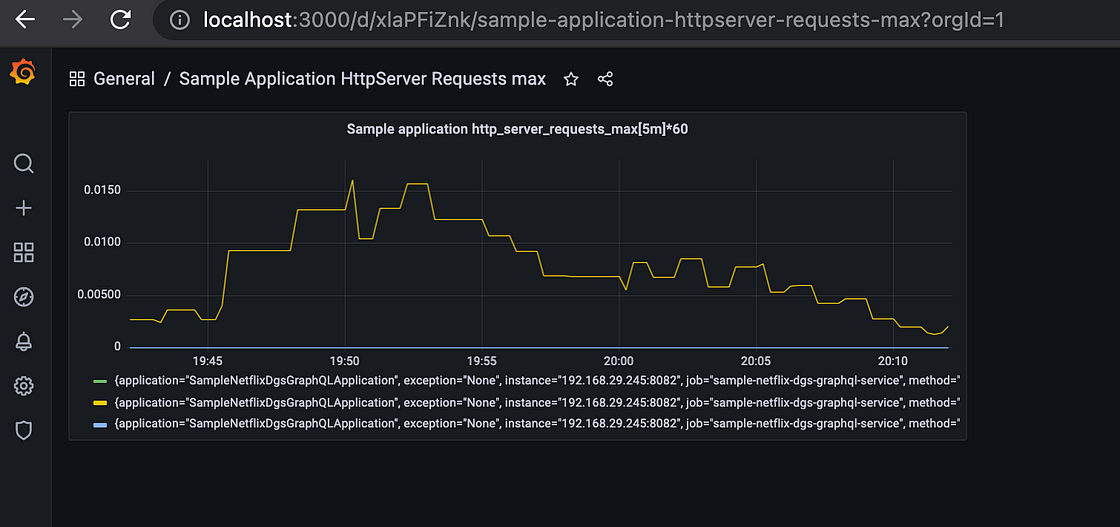
Similarly to see the endpoint calls we can use the below query, which tells the maximum amount recorded. When this represents a time, it is reported in the monitoring system’s base unit of time. It means that one of our endpoints in the range (/graphql shown with red color) called a @Timed function that took the graphed time to execute.
rate(http_server_requests_seconds_max[5m]) * 60
We are done here with Prometheus, we can explore more by going through the documentation, as this offers a wide range of queries, using PromQL, that we can use to create dashboards.
Grafana — Integrating Prometheus to supply metrics.
It’s a multi-platform open-source analytics and interactive visualization web application. It offers a range of charts, graphs, and alerts for the web when connected to supported data sources.
Datasources it supports are:
Let’s start by setting up the Grafana server, and here again, we will be using Docker to get that up and running as a container in the machine. Let’s use the command mentioned below to pull and run the docker image.
docker run -d --name=grafana -p 3000:3000 grafana/grafana
Now once the container is up and running, we can access Grafana using URL as — http://localhost:3000/login which takes us to the below screen.
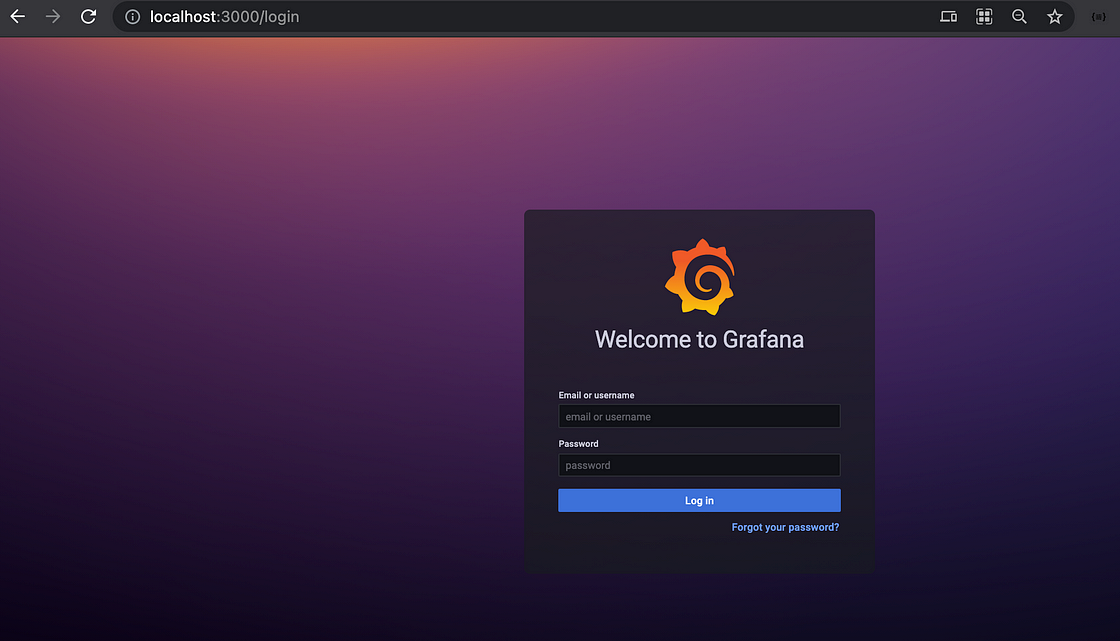
The default username/password is admin/admin. Let’s log in and create a new password on the first login. And we are into the Grafana dashboard.
As a first step we need to configure the Datasource and for the let’s click on the Configuration icon in the navigation panel on the left side and hit Data sources. Depicted below.
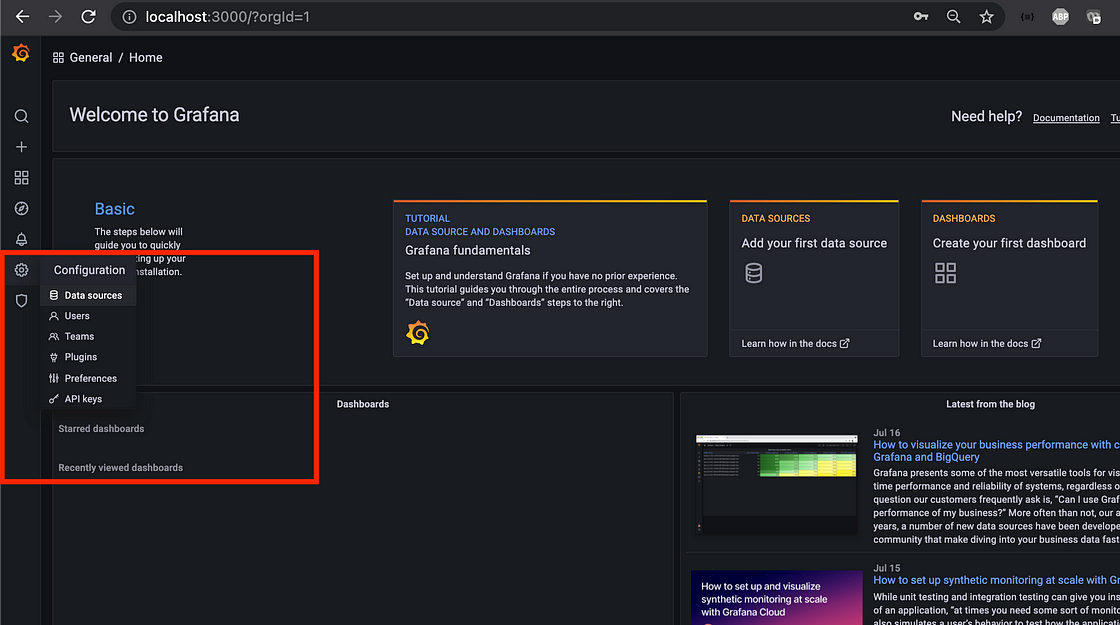
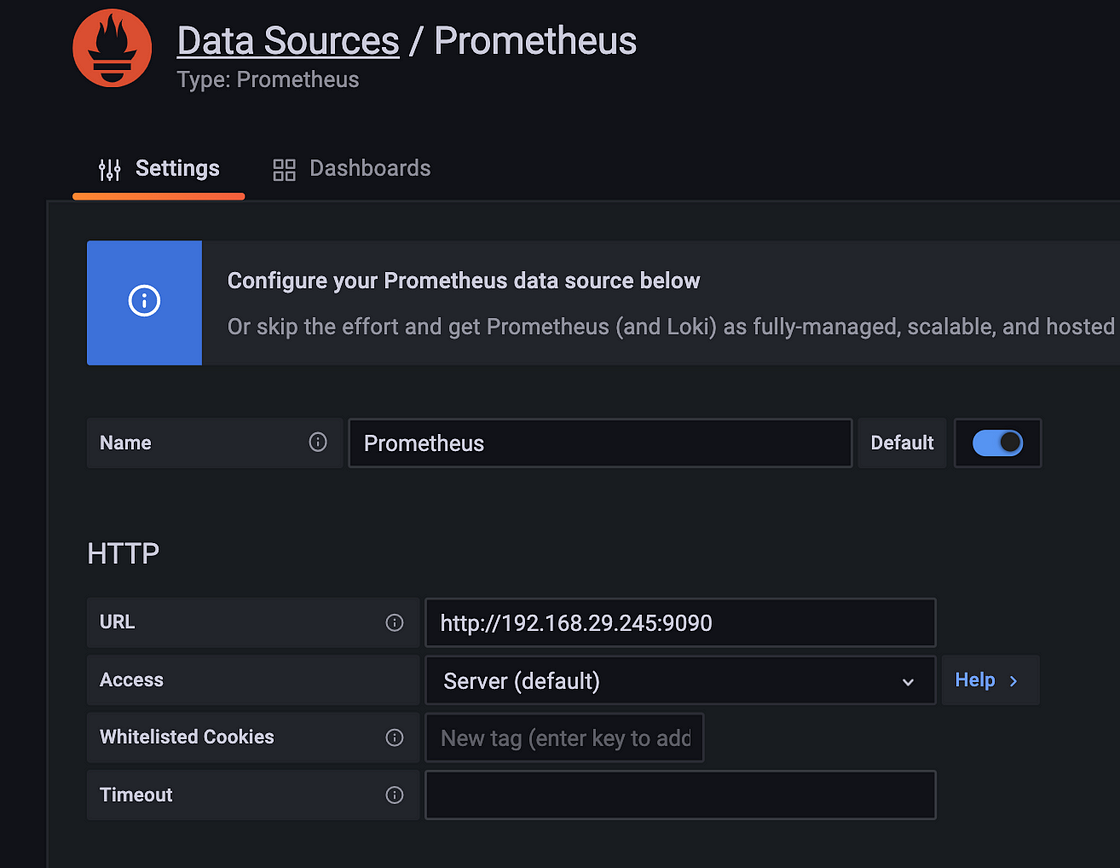
Now let’s configure the data source from various provided data sources, here we will use Prometheus as we have just set it up. And this is how Prometheus helps to supply monitoring metrics to Grafana to create dashboards for us.
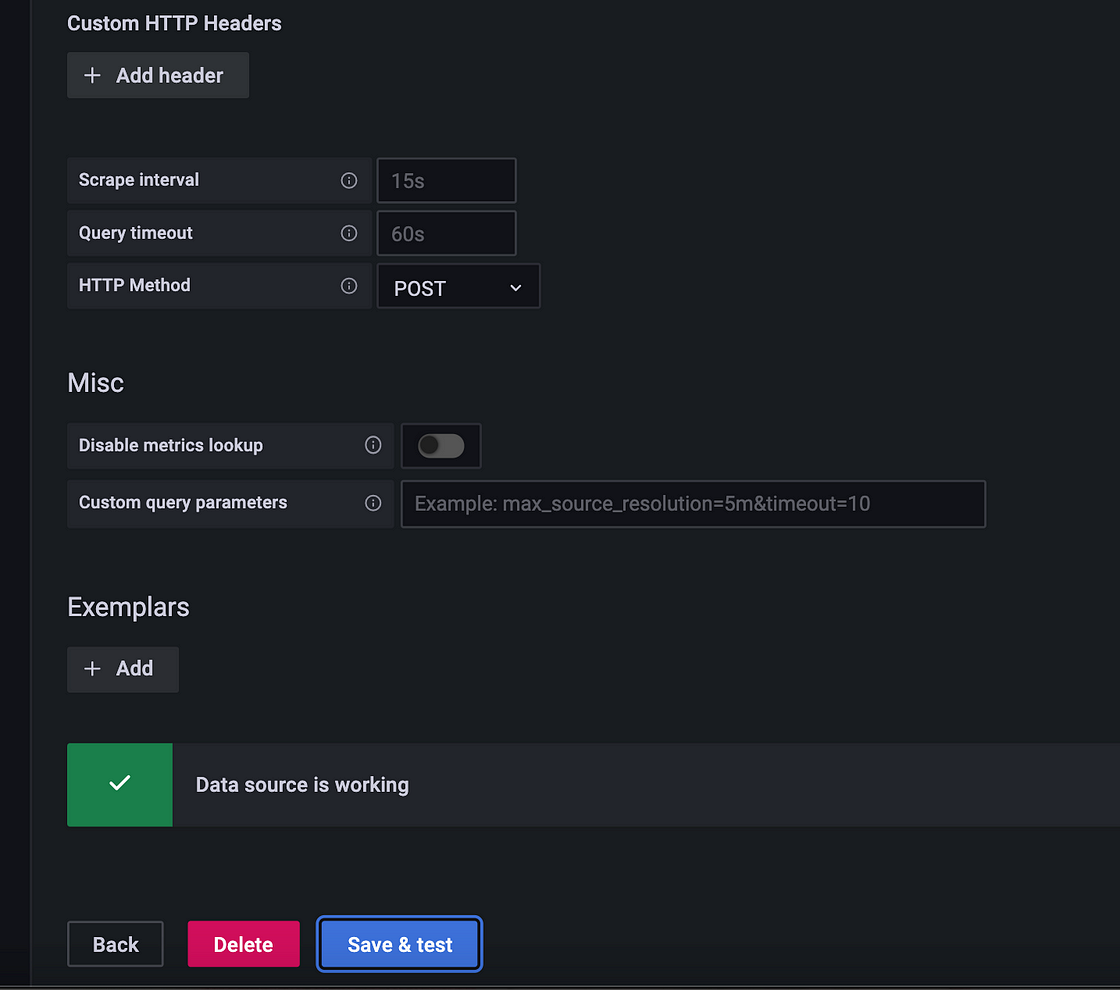
Let’s configure the Prometheus by providing the endpoint for Prometheus and scroll below to click Save & Test (It should say Data source is working, or else just get the correct IP address of the machine for local networking)
Now let’s create a dashboard for our application and supply the above-mentioned PromQL.
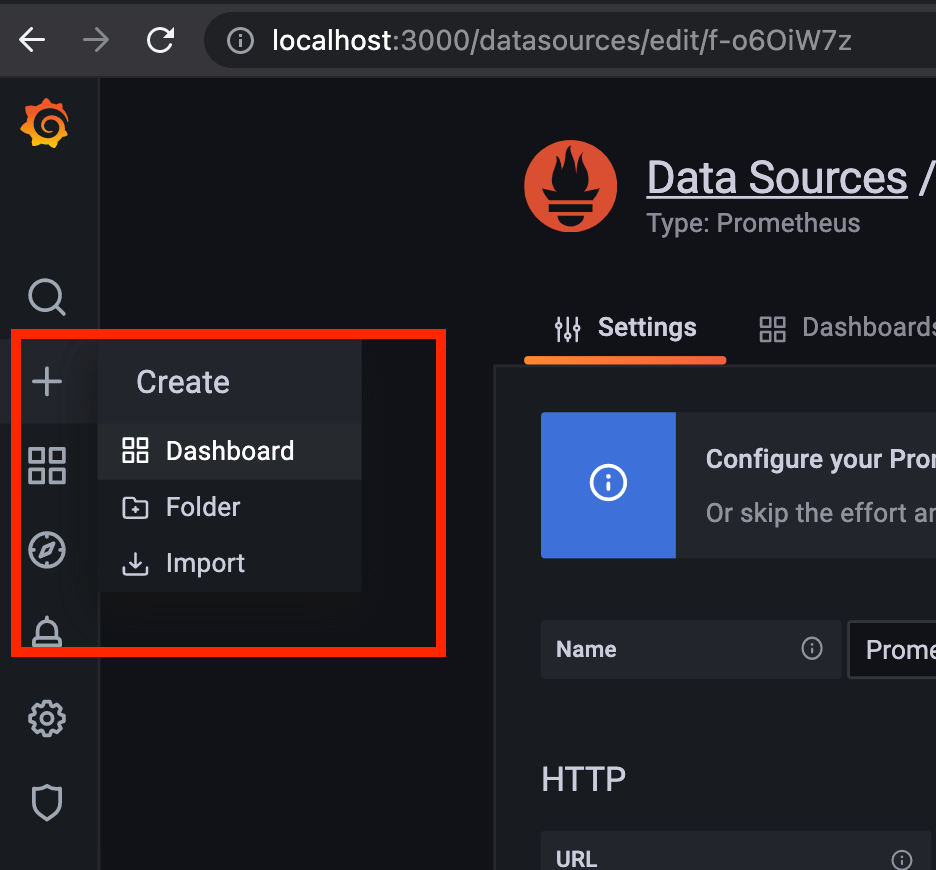
Click on the Create Dashboard icon and on the next screen, click on Add an empty panel.
Follow the steps highlighted in the screen below with numbered action items.
We can use either the existing metrics or use the custom metrics using PromQL. Shown with number 1 and number 2, can use either.
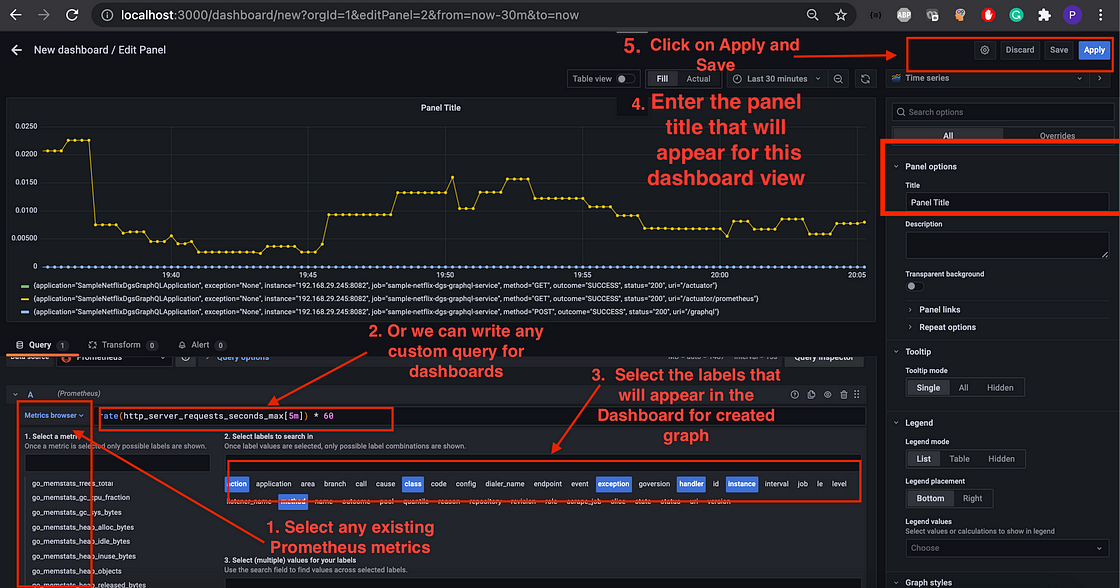
And once we click on Save and provide a dashboard name, we should see the dashboard created for us.
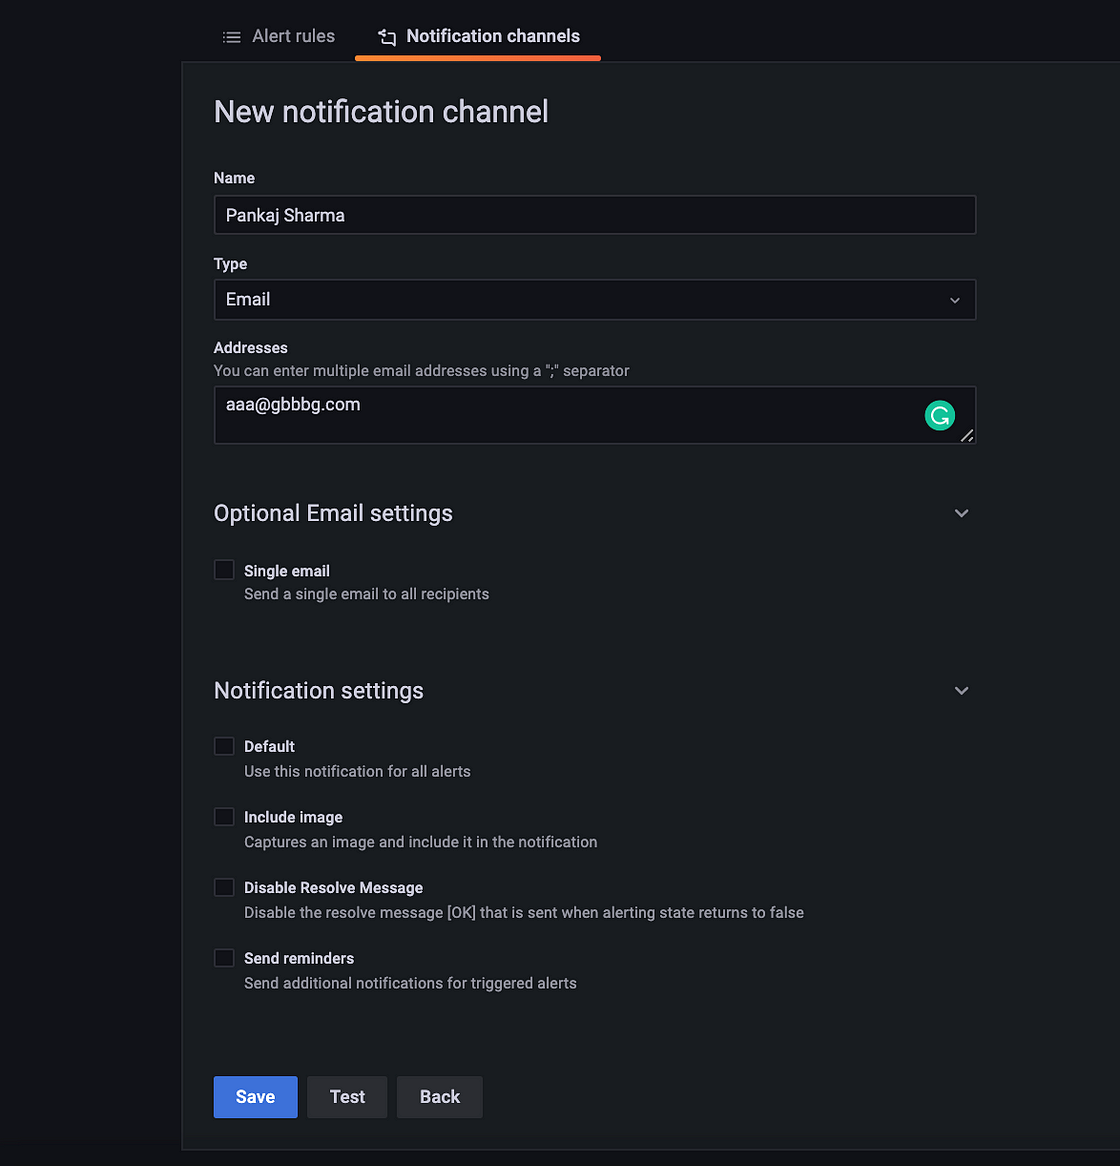
We can configure and create Notifications and alerts as well using Grafana too. We can various types of notification channels that we can configure in the Grafana whenever an alert happens, we will be notified.
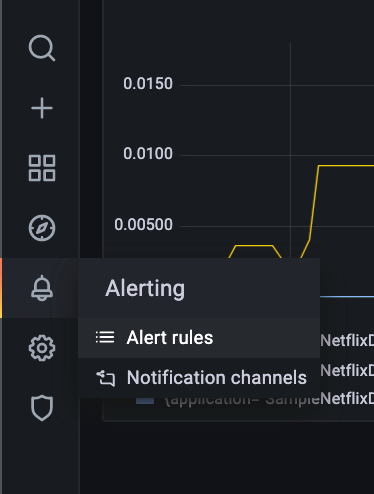
Under notification channels, we can add any Notification channel Type from the dropdown.
Now let’s go back to the Panel we created, let’s click Edit Panel, and hit the third tab (where we added Query) we have is Alert.
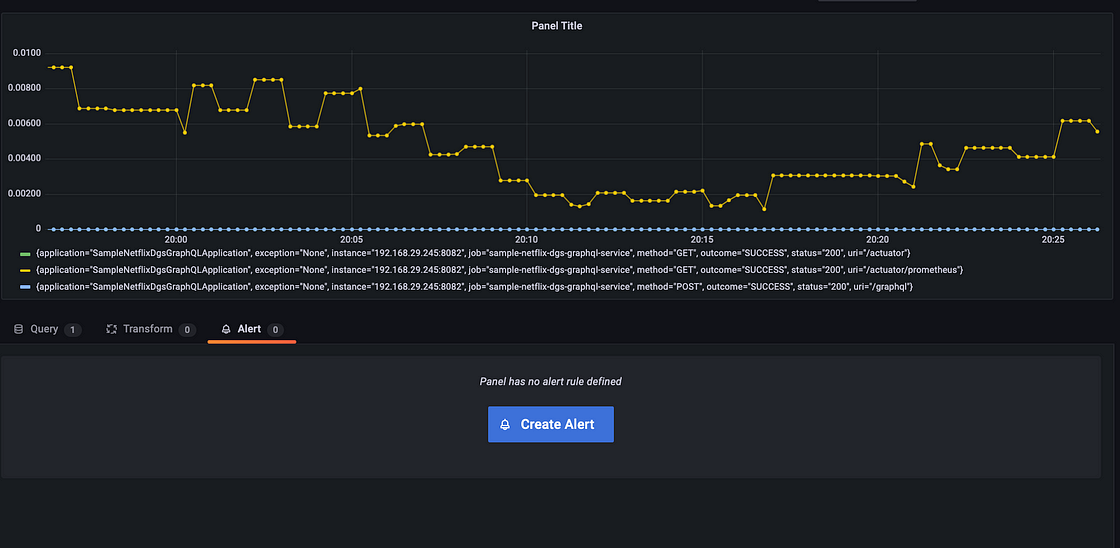
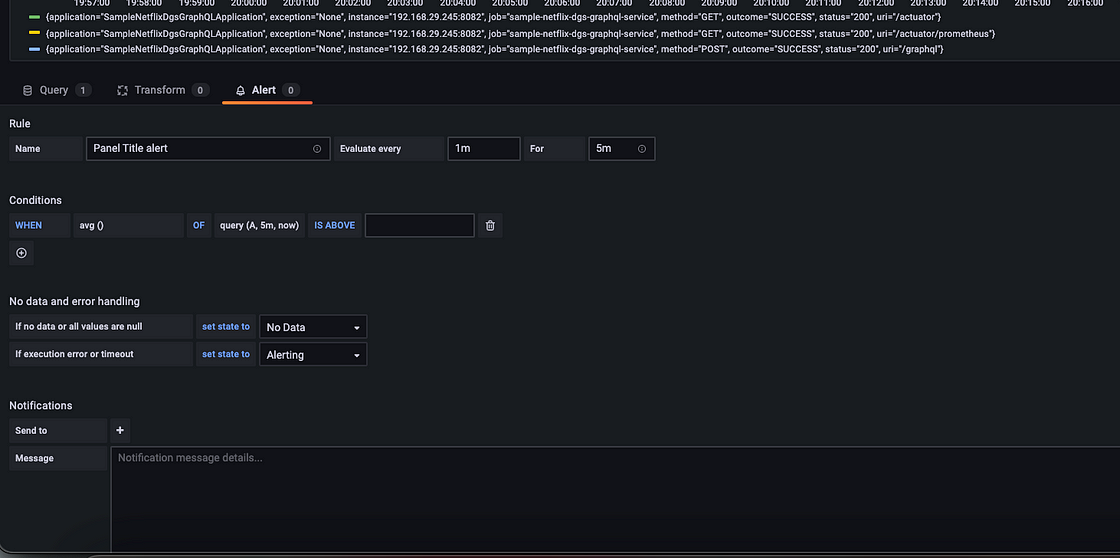
These alerts will be triggered and based on the notification channel it will be served.