Prometheus Counter Metrics
Credits: Bas de Groot – https://levelup.gitconnected.com/prometheus-counter-metrics-d6c393d86076
Prometheus counter metric takes some getting used to. The official documentation does a good job explaining the theory, but it wasn’t until I created some graphs that I understood just how powerful this metric is.
This article combines the theory with graphs to get a better understanding of Prometheus’ counter metric. We will see how the PromQL functions rate, increase, irate, and resets work, and to top it off, we will look at some graphs generated by counter metrics on production data.
The only way is up…
As you might have guessed from the name, a counter counts things. It does so in the simplest way possible, as its value can only increment but never decrement¹.
Whilst it isn’t possible to decrement the value of a running counter, it is possible to reset a counter. A reset happens on application restarts.
This behavior makes counter suitable to keep track of things that can only go up. Some examples include:
- The number of beers you drink
- The total distance you drive in a car
Or in application development:
- The total amount of HTTP requests
- The total amount of log messages
- The total amount of job executions
Never use counters for numbers that can go either up or down. For example, you shouldn’t use a counter to keep track of the size of your database as the size can both expand or shrink.
Working with counters
In this section, we will look at the unique insights a counter can provide. We will use an example metric that counts the number of job executions.
This piece of code defines a counter by the name of job_execution. The application metrics library, Micrometer, will export this metric as job_execution_total. The execute() method runs every 30 seconds, on each run, it increments our counter by one.
Raw counter values
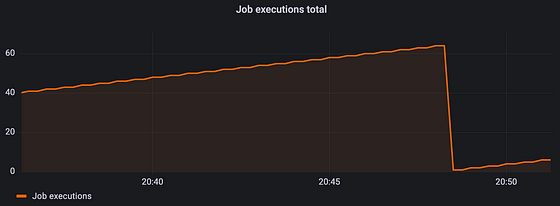
The insights you get from raw counter values are not valuable in most cases. If we plot the raw counter value, we see an ever-rising line.
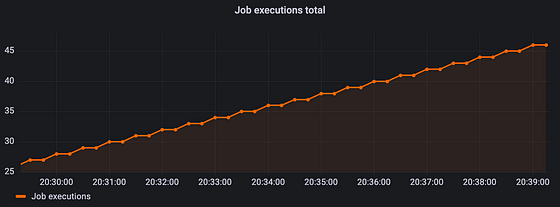
This line will just keep rising until we restart the application. When the application restarts, the counter is reset to zero.
Lucky for us, PromQL (the Prometheus Query Language) provides functions to get more insightful data from our counters.
Rate
Prometheus’ rate function calculates at what rate the counter increases per second over a defined time window. The following PromQL expression calculates the per-second rate of job executions over the last minute².
rate(job_execution_total[1m])
Our job runs at a fixed interval, so plotting the above expression in a graph results in a straight line.
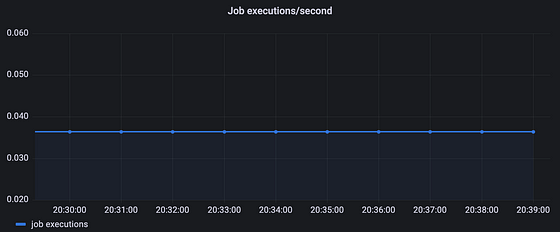
From the graph, we can see around 0.036 job executions per second. Multiply this number by 60 and you get 2.16. This is higher than one might expect, as our job runs every 30 seconds, which would be twice every minute.
The way Prometheus scrapes metrics causes minor differences between expected values and measured values. Depending on the timing, the resulting value can be higher or lower. It’s important to remember that Prometheus metrics is not an exact science.
PromQL’s rate automatically adjusts for counter resets and other issues. So whenever the application restarts, we won’t see any weird drops as we did with the raw counter value.
Breaks in monotonicity (such as counter resets due to target restarts) are automatically adjusted for. Also, the calculation extrapolates to the ends of the time range, allowing for missed scrapes or imperfect alignment of scrape cycles with the range’s time period. — Prometheus docs
One last thing to note about the rate function is that we should only use it with counters. It makes little sense to use rate with any of the other Prometheus metric types.
Increase
Prometheus’ increase function calculates the counter increase over a specified time frame². The following PromQL expression calculates the number of job executions over the past 5 minutes.
increase(job_execution_total[5m])
Since our job runs at a fixed interval of 30 seconds, our graph should show a value of around 10.
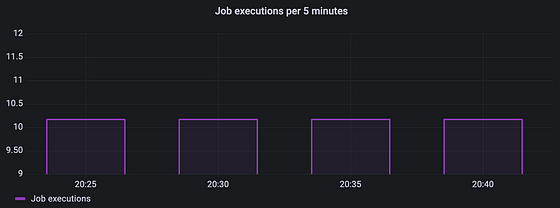
Prometheus extrapolates increase to cover the full specified time window. Because of this, it is possible to get non-integer results despite the counter only being increased by integer increments¹.
Similar to rate, we should only use increase with counters. It makes little sense to use increase with any of the other Prometheus metric types.
Irate
This metric is very similar to rate. Just like rate, irate calculates at what rate the counter increases per second over a defined time window. The difference being that irate only looks at the last two data points. This makes irate well suited for graphing volatile and/or fast-moving counters².
The following PromQL expression returns the per-second rate of job executions looking up to two minutes back for the two most recent data points.
irate(job_execution_total[2m])
We should only use Irate with counters.
Resets
Prometheus’ resets function gives you the number of counter resets over a specified time window². The following PromQL expression calculates the number of job execution counter resets over the past 5 minutes.
resets(job_execution_total[5m])
We should only use resets with counters.
Real-world example graphs
The graphs we’ve seen so far are useful to understand how a counter works, but they are boring.
To give more insight into what these graphs would look like in a production environment, I’ve taken a couple of screenshots from our Grafana dashboard at work.
I’ve anonymized all data since I don’t want to expose company secrets…
The graph below uses increase to calculate the number of handled messages per minute. When plotting this graph over a window of 24 hours, one can clearly see the traffic is much lower during night time.
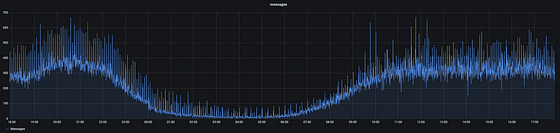
Here we have the same metric but this one uses rate to measure the number of handled messages per second.
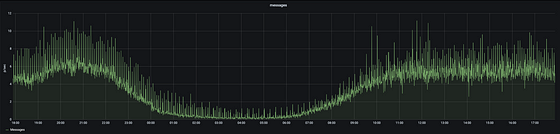
As one would expect, these two graphs look identical, just the scales are different. Which one you should use depends on the thing you are measuring and on preference.
In this example, I prefer the rate variant. I think seeing we process 6.5 messages per second is easier to interpret than seeing we are processing 390 messages per minute.
Conclusion
The Prometheus counter is a simple metric, but one can create valuable insights by using the different PromQL functions which were designed to be used with counters. Which PromQL function you should use depends on the thing being measured and the insights you are looking for.
Thank you for reading. I hope this was helpful. Feel free to leave a response if you have questions or feedback.
References
[1] https://prometheus.io/docs/concepts/metric_types/
[2] https://prometheus.io/docs/prometheus/latest/querying/functions/